HELP
The documentation below is provided to guide you through CrimeMapping.com.Map
Everything you need to know about using the map
- O: Search near a location from the home page
- O: Search for an Agency from the home page
- O: Zoom to an area
- O: Zoom in to view records
- O: Resolve the "Max Records Reached" status message
- O: Resolve the "No Data Found" status message
- O: Resolve the "No Records Found" status message
- O: Resolve the "Missing Records" status message
- O: Agency information panel
- O: Working with the Agency Filter
- O: Choosing record categories
- O: Offender data availability
- O: Change the date range
- O: Locate an address or point of interest
- O: Search for crimes around an address or point of interest
- O: Summary Panel
- O: Share a record
- O: Share this Map
- O: Zoom to a record
- O: Find the distance between an address and a record
- O: Manually measure distance on the map
- O: Print the Map
- O: Understanding Pictometry
Reports
Instructions on how to create and use detailed reports and charts
Alerts
What are CrimeMapping.com alerts and how to sign up
Map
Everything you need to know about using the map
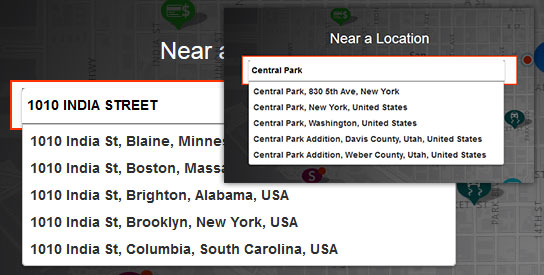
O: Search near a location from the home page
Search any desired address, landmark or zip code on the home page. Suggestions will be provided to you in alphabetical order for quick selection.
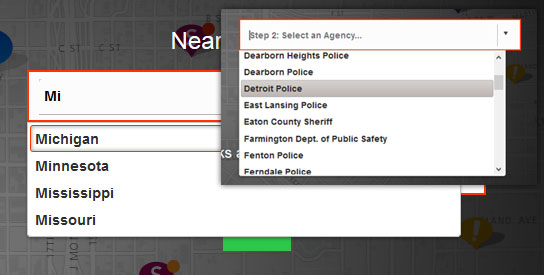
O: Search for an Agency from the home page
Search for an agency by name using "Near an Agency" on the home page. First select a state or province, then select an agency from the list or type an agency name. Hit the GO button to zoom to launch the map.
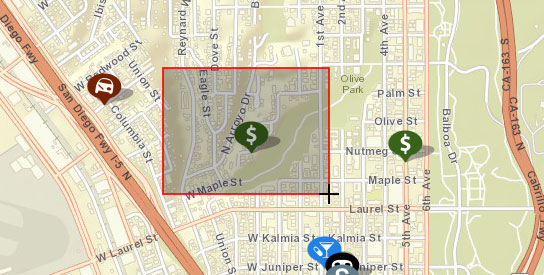
O: Zoom to an area
Hold down the SHIFT key on your keyboard and use the left mouse button to choose an area to view more closely. Release the mouse button and the map will zoom to your selection.
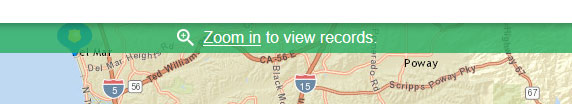
O: Zoom in to view records
You have zoomed too far out. Simply zoom in closer. If there is data for the area you should see it appear.
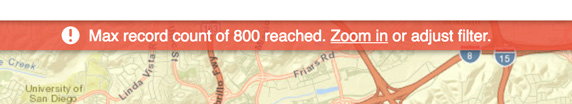
O: Resolve the "Max Records Reached" status message
The 'Max Records Reached' status message indicates that the map cannot show the large number of records that have been selected by your query. Try narrowing your selection by changing the options on the What/Where/When panels or by zooming into the map to view a smaller search area.
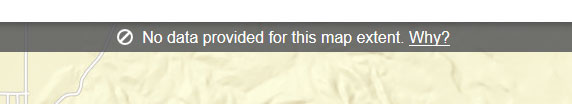
O: Resolve the "No Data Found" status message
This message appears when the map does not currently contain incidents or sex offender data because no local agencies in the area subscribe to CrimeMapping.com.
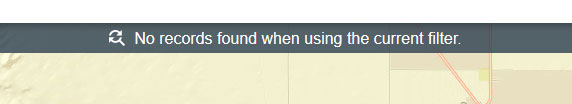
O: Resolve the "No Records Found" status message
This message indicates that while one or more agencies in this area may subscribe to CrimeMapping.com, there is no data available based on the filter parameters chosen. Try expanding your filters by changing your selections on the What/Where/When panels to the left of the map.
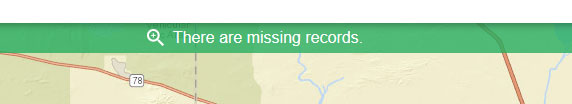
O: Resolve the "Missing Records" status message
When in "Alert Preview Mode" you may notice some records from your report are not shown on the map. This is caused when the agency that maintains the source data from which the alert is created has removed an incident in the time since the alert was sent.
O: Agency Information Panel
Information related to the agency, such as links to related websites or a "Sex Offender Disclaimer" for agencies that choose to provide offender data, are made available in the "Agency Information Panel". To display the panel to the right of the map you may (1) click on the "Shield" icon on the top right above the map, (2) click on the agency name when displayed in the "Incident Details Panel", or (3) click on an agency's "Shield" icon that is displayed on the map.
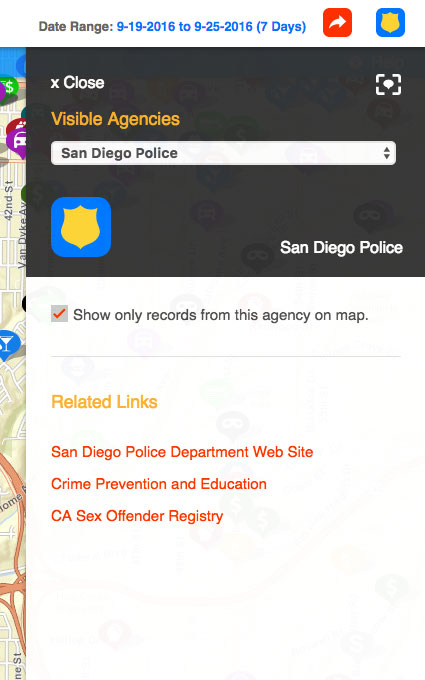
O: Working with the Agency Filter
While within the "Agency Information Panel" you can choose to view only the records provided by the chosen agency on the map by checking the "Show only records from this agency on map." box. You can remove this filter in one of three ways:
- 1. Simply uncheck the box.
- 2. Use the "Remove Filter" button within the status bar atop the map.
- 3. Use the "Restore Defaults" button on the Summary Panel.
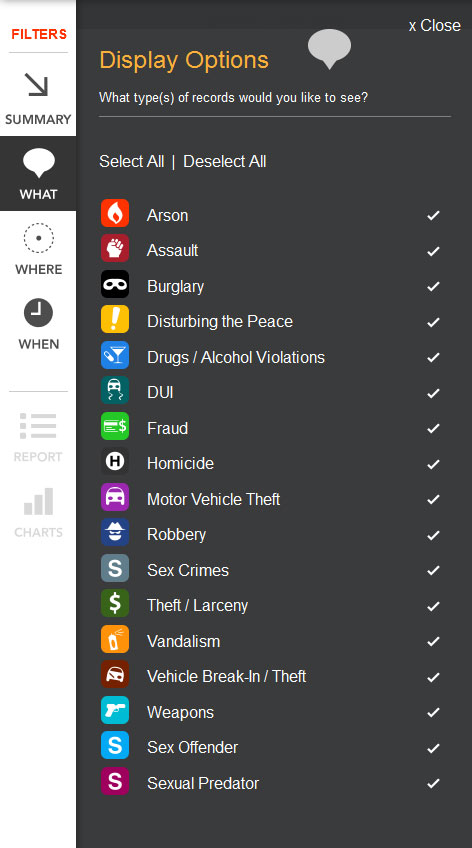
O: Choosing record categories
To display only certain record categories on the map, hit the “What” button in the left-side toolbar. The pop-out menu will provide the fifteen (15) incident categories and the two (2) sex offender categories to choose from. Check and/or uncheck the desired record categories.
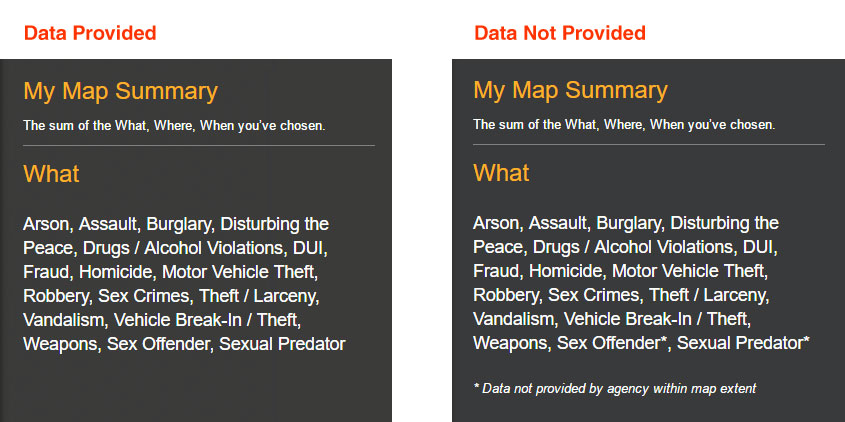
O: Offender data availability
Many agencies choose to provide Crime data to CrimeMapping.com but not Sex Offender and/or Sexual Predator data. On the What panel you can easily see if an agency within your map view is or isn't providing it.
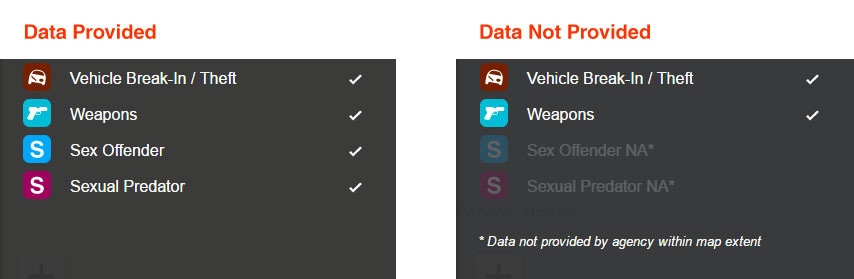
The "What" section within the Summary panel will also indicate when your map view will not display Sex Offender or Sexual Predator due to the fact that the Agency(s) located within your map view are not providing it.
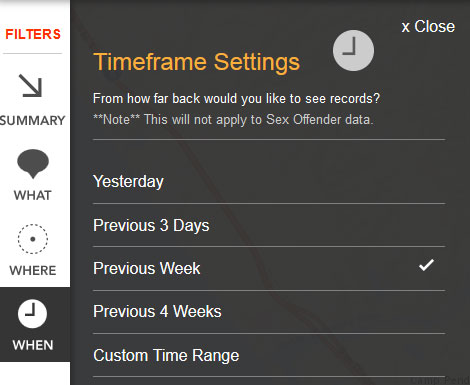
O: Change the date range
To adjust the date range of the records displayed, choose the “When” button in the left-side toolbar. Within the pop-out menu are predetermined date ranges to choose from, as well as a "Custom Time Range" option. Choose one of the predefined time ranges or use the "Custom Time Range" option, adjust the corresponding calendar controls and hit “Apply”.
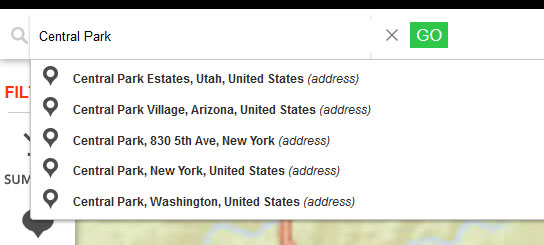
O: Locate an address or point of interest
To direct the map to a specific address or point of interest, use the location search box above the map on the top left of the screen and hit “Go”. The map will zoom to the chosen location and show all surrounding records.
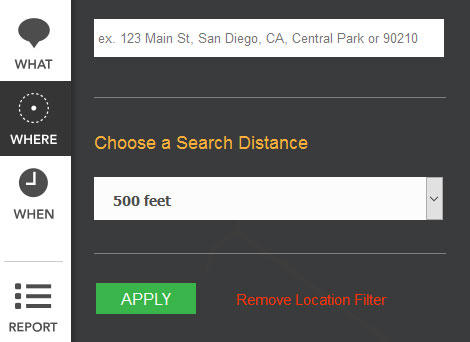
O: Search for crimes around a point of interest
To search for crimes around a specific address or point of interest, choose the “Where” button in the left-side toolbar. Within the pop-out menu is a text box to search your address or point of interest alphabetically. A drop down menu allows you to choose from a list of search distances. Hit “Go” and the map will zoom to the location provided and only display records with in the selected search distance.
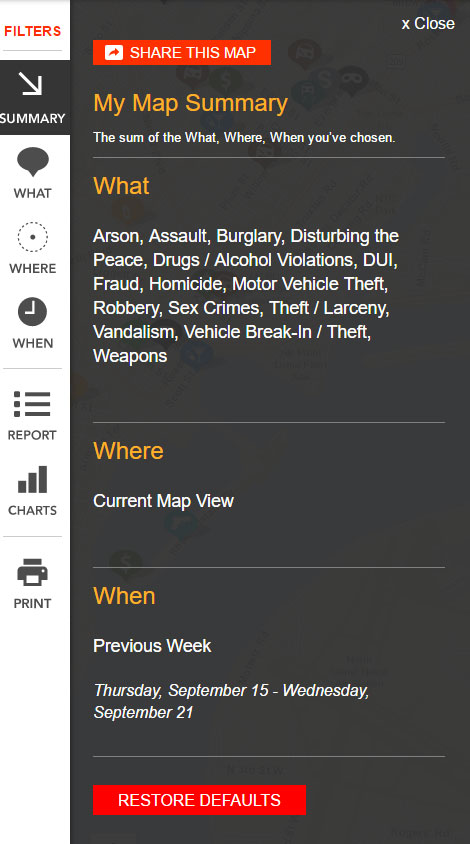
O: Summary Panel
This panel, located at the top of the filter options to the left of the map, allows you to review your selections. You can clear any of the applied filters from this panel by clicking the "RESTORE DEFAULTS" button.
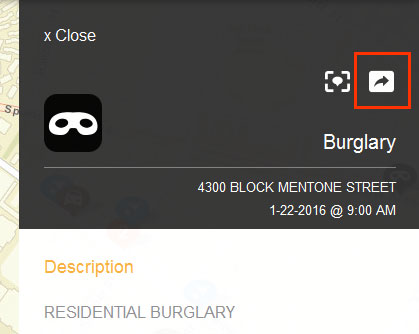
O: Share a record
On the map, select a record and the right sided pop-out menu will appear on the screen. Choose the “Share This Record” icon in the menu. A pop-up window will appear providing a link and instructions on how to copy the text. Place the link in an email and send to your contact.To close the window hit “Done”.
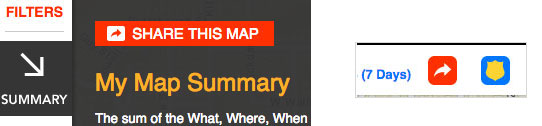
O: Share this map
The current map view can be shared via copying a hyperlink generated by CrimeMapping to your clipboard and pasting it elsewhere, such as in an email or text message. There are two "Share This Map" buttons that reveal access to this hyperlink. One is within the Summary panel and the other is within the top white toolbar bordering the map towards the top right of your browser.
If Yesterday, Previous 3 Days, Previous Week or Previous 4 Weeks has been selected on the When panel once the Share This Map hyperlink has been generated then the hyperlink will always bring a user to its literal equivalent no matter when it is accessed. For example, assume it is August 7. If "Previous Week" is selected on the When panel the date range will be August 1-7. If you were to "Share This Map" on August 7 and the recipient followed the hyperlink on August 7 the date range would be August 1-7. However, if the recipient were to again access the hyperlink on September 7 the date range would then become September 1-7.
However, an explicit date range can be set by using the "Custom Time Range" selection controls on the When panel. For example, assume it is August 7 once again and you have chosen to set the date range explicitly from August 1 to August 7 using the calendar controls. If you were to "Share This Map" on August 7 and the recipient visited the link on August 7 the date range would be August 1-7. Furthermore, if the recipient were to reuse the hyperlink on September 7 the date range would still be August 1-7.
O: Zoom to a record
In order to center and zoom to a particular record, select the chosen record on the map and the left sided pop-out menu will appear on the screen. Choose the “Zoom to Record” link and the map will zoom to the record and center it on the screen.
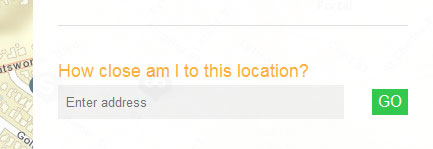
O: Find the distance between an address and a record
Select an individual record on the map to open up the right-side pop-out menu. Within the “How close am I to this location?” textbox, search for an address and hit "Go". The map will display an information bubble next to the desired address showing the distance in miles to the selected record. Distances are provided in miles, feet, kilometers, and meters with miles being the default unit of measurement.
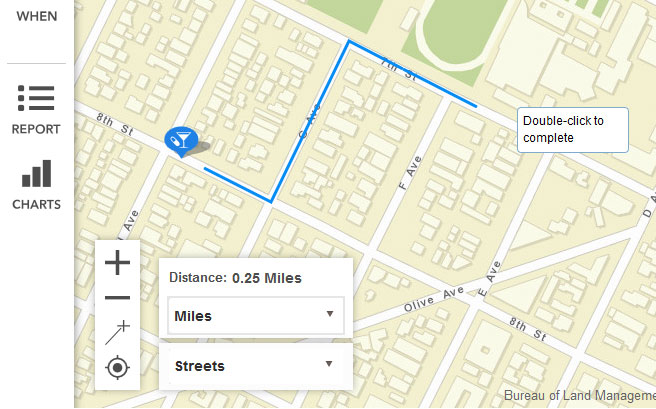
O: Manually measure distance on the map
Choose the distance tool from the tools in the lower left corner of the map. Begin by clicking on the map, and continue to click with the mouse to add one or more anchor points. Double-click to end the line. The distance is provided in the lower left corner of the map. Distances in miles, feet, kilometers, and meters are provided, with miles being the default unit of measurement. Click the screen again to clear the tool from the map.
O: Print the Map
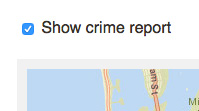
The map may be printed at any time by selecting the 'Print' tool from the toolbar to the left of the map. You may also choose to include the crime report once you have opened the print page.
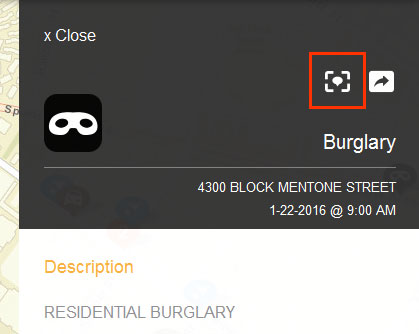
O: Understanding Pictometry
Some agencies may choose to supply imagery for their jurisdiction that is sourced from the Pictometry International Corporation. Pictometry imagery captures the fronts and sides of buildings and locations on the ground to show oblique perspectives of the landscape. It is the agency's responsibility to provide CentralSquare Technologies with the appropriate license from Pictometry in order to display this imagery in CrimeMapping.com.
If an agency has chosen to make Pictometry imagery available, you can access the imagery by selecting an incident or sex offender on the map. Once selected, the details panel that is revealed includes the Pictometry button which can be used to open a new browser window. The incident or offender type, address, date and time reported (if available) and location are provided using the Pictometry imagery as a backdrop.
Depending on the Pictometry license used by the agency, you may have access to tools that are useful to navigate the Pictometry imagery. These tools can include navigation controls, additional layer information such as streets and contours, historical imagery and the capability to create a PDF. CentralSquare Technologies does not have the ability to make any modifications to these tools, and so requests or suggestions should be made directly to Pictometry.
IMPORTANT: Pictometry imagery cannot be used to accurately identify the locations of incidents or sex offender residences. The incidents provided to CentralSquare Technologies are geocoded to the block level, offenders are geocoded to the street centerline. Actual addresses and locations have been generalized and may be different from those depicted on maps or other aerial photography, such as Pictometry. The information and visual results contained here are for general reference to associated areas and are not intended for navigation or any other action that may require precision.
Reports
Instructions on how to create and use detailed reports and charts
O: Creating a Detailed Report or Chart
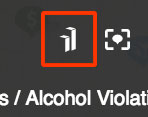
To view a report or the charts of the records shown on the map, select the “Charts” or "Report" icon located to the left of the map. The "Detailed Report" and the "Charts" will only include the records shown on the map at the time of selection. To switch between the "Charts" and the "Detailed Report", click on the same icons, now displayed on the left hand side of the screen. To get back to the map select the “Back to Map” link on the top right of the screen.

O: Understanding the Crime Incidents Report
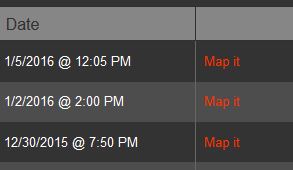
The Crime Incidents report displays information about each incident as a row in the report. The date range that was used to display these records is available at the top right of the report, and the number of records within the report is found next to the date range.
O: Crime Incident Report columns and their source
The columns in order from left to right are:
- Map It: click on this link to return to the map with your selected record highlighted
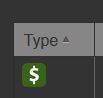
- Type: crime type that identifies one of the fifteen (15) selected categories
- Description: description of the crime that is provided by the agency
- Incident #: unique number that identifies the record; supplied by the agency
- Location: address of the incident moved to the 100 block
- Agency: name of the agency that supplied the record
- Date: date and time the crime was reported
O: Understanding the Sex Offender Reports
Some agencies may choose to supply sex offender data to CrimeMapping.com. If you navigate to an area on the map where an agency is supplying offender data, you may view the additional information about each of the icons on the map within a Sex Offender report. Before viewing the report you will be asked to agree to a disclaimer. If the offender records that you are viewing on the map are supplied by multiple agencies, you will see one report per agency in the Detailed Reports screen as each agency may supply different details about the offenders in their area.
There is the option to include unmappable offenders within the report. Unmappable offenders are those that do not have a valid address. Unmappable offenders can be included in the report but cannot be shown on the map.
O: Filtering the Reports
Each column provided in the reports can be sorted in an ascending or descending order. When the data is first loaded into the report; it is provided in the order it is found within the map. To sort the data in ascending order, click on the column name at the top of the report. Click a second time to sort the data in descending order.
O: Mapping a record
To view a record from the detailed report on the map, select the “Map it” link on the left most part of the incident row. The map will then appear with the chosen incident at the center.
O: Understanding the Charts
The "Day of Week Summary" bar graph and a "Crime Summary" pie chart are based on the crime incidents that are shown on the map.
The "Day of Week Summary" bar graph identifies the number of crimes that occurred by type, and by day of week. The "Crime Summary" pie chart provides a visual percentage of all crimes currently displayed on the map.
O: Print the Crime Report
The Crime Report can be printed by selecting the "Print" tool from the toolbar to the left of the map. Once the print page is open, you can choose to include the report with the map.
Alerts
What are CrimeMapping.com alerts and how to sign up
O: Create CrimeMapping Alert
To create an alert, select the "RECEIVE ALERTS" button at the top right corner of the home or map page

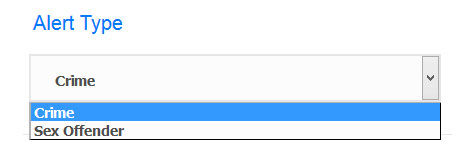
O: Alert Type
There are two possible versions of the CrimeMapping.com Alert, “Crime” and “Sex Offender.” Select the preferred type from the drop down menu before continuing.
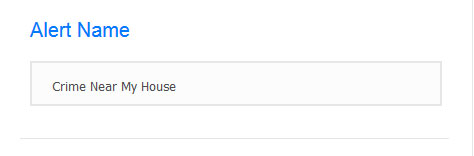
O: Alert Name
Enter a name for the alert in the “Alert Name” textbox.
O: Email Address
Provide a valid email address to receive the alert. You can create more than one alert. Each alert can be sent to the same email address.
O: Email Preferences
In this section, choose whether or not to receive the email in HTML or Text format. You must also choose a display preference, "Table View" or "List View". Please see the next help topic (below) for further detail on display preferences. Also keep in mind that some email clients do not allow HTML emails due to built in security settings.
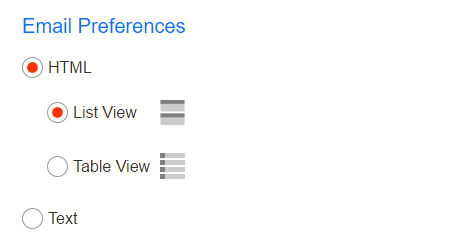
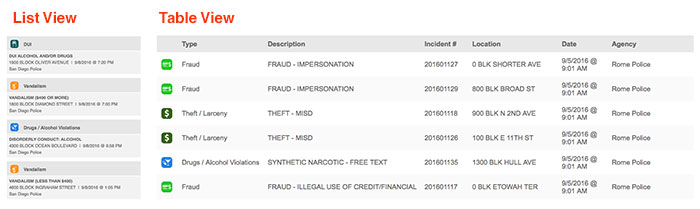
O: Adjust Alert Display Preferences
When you create an alert you have the option of choosing one of two different email format types, HTML and text based. If you select HTML you then have the option of choosing one of two display formats, "Table View" and "List View". Once you set these preferences they will apply to ALL alerts you have created. The "Table View" display type will maximize the screen space better if you are a user who mainly uses a desktop computer or tablet to view your alert emails. The "List View" display type will maximize the screen space better if you are user who mainly uses a mobile phone to view your alert emails.
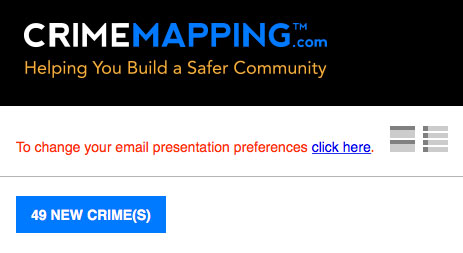
Once your alert(s) have been created you can change either of these settings by clicking the change display preferences link at the top of any future alert email you receive. Doing so will take you to an alert prefences page where you can make the adjustment.
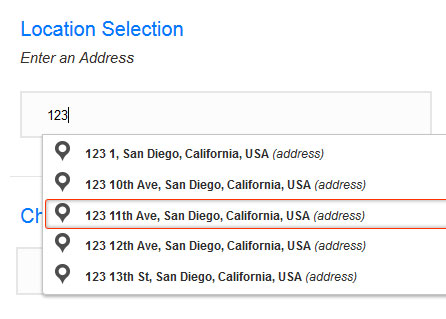
O: Location Selection
Enter an address, point of interest or zip code as the center point of your search for crimes or sex offenders.
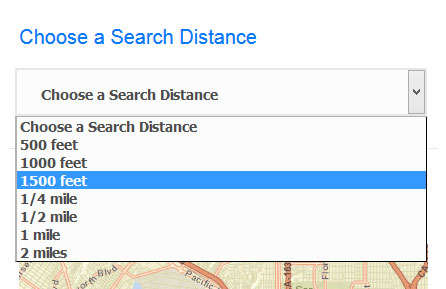
O: Choose a Search Distance
Choose a distance from the drop down menu. The distance will be used to search for crimes or sex offenders depending on the type of alert specified.
O: Verify Address
The Verify Address button can be used to quickly identify if agencies are supplying crime or sex offender data for the address, point of interest or zip code you wish to search. If an agency is not supplying data for your area of interest, you will be notified with the Verify Address button or when you attempt to save your alert.
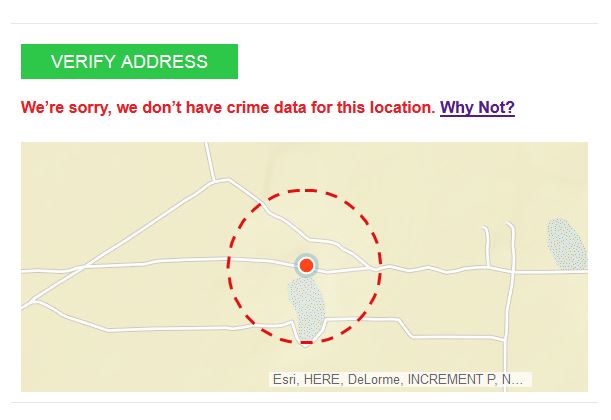
O: Address Won't Verify
If you receive the 'We don’t have crime data for this location’' or 'We do not have sex offender data for this location' message after attempting to verify your location, it is because the local law enforcement agency does not provide data to CrimeMapping.com. Feel free to read more about this within our FAQ here.
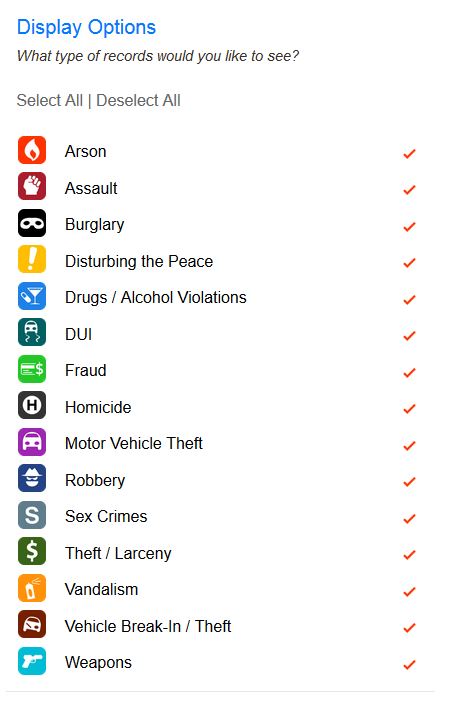
O: Display Options
From the list of categories, choose the crime or sex offender types that you want included in the alert email.
O: Sex Offenders
Selecting 'Yes, I want to link to state sex offenders in my alert' will include a link in your alert to the appropriate state sex offender website for your area.

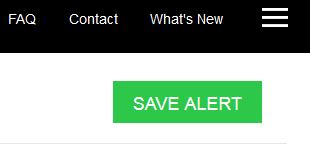
O: Save Alert
To save the alert, select the “Save Alert” button on the top right corner of the screen.